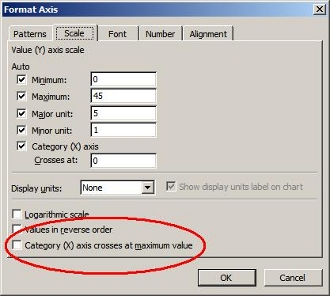
 Figure 1: The "Category (X) axis crosses as maximum value" option in Excel
Excel has a property called "Category (X) axis crosses at maximum value" that can be accessed through the 'Scale' tab of the 'Format Axis' dialog (Fig. 1, right). Turning this property on makes column charts draw themselves from the top of the chart instead of the bottom. Note that it does not change the values on the axis, so all the columns will still end in the same place. See Figure 2 (below) for a comparison of two charts, one with this property turned off and one with it on.
ExcelApplication has an equivalent property in the ValueAxis object: CategoryAxisCrossMaxValue. In your code, you can manually set this property to either true or false.
In versions 3.9.2 and earlier, ExcelWriter automatically set this property to true for the secondary value axis whenever you added a series to the secondary axis. This had the effect of turning every series of column data on the secondary axis upside down.
In versions 4.0 and later, ExcelWriter does not set this property to true when you add a series to the secondary axis. By default it is false, so columns will be drawn from the bottom. If you explicitly set it to true, ExcelWriter won't change its value when you add a series to the secondary value axis.
The upshot of all this is that if you want column charts to render with the columns on the secondary axis and drawn from the bottom, you need one extra line of code in versions 3.9.2 and before:
|
[C#]
|
[VB.NET]
|
|
// Column chart on the secondary axis from the bottom in 3.9.2:
Chart chart = ws.Charts.CreateChart(ChartType.Line.StandardLine,
                                    ws.CreateAnchor(0, 2, 0, 0));
SeriesCollection series = charts.SeriesCollection;
Series column = series.CreateSeries(ws.CreateArea("A1:A20"));
Series line = series.CreateSeries(ws.CreateArea("B1:B20"));
column.ChartType = ChartType.Column.Clustered;
column.AxisType = AxisType.Secondary;
chart.SecondaryValueAxis.CategoryAxisCrossMaxValue = false;
'  Column chart on the secondary axis from the bottom in 3.9.2:
Dim chart As Chart = ws.Charts.CreateChart(ChartType.Line.StandardLine,
                                           ws.CreateAnchor(0, 2, 0, 0))
Dim series As SeriesCollection = chart.SeriesCollection
Dim column As Series = series.CreateSeries(ws.CreateArea("A1:A20"))
Dim line as Series = series.CreateSeries(ws.CreateArea("B1:B20"))
column.ChartType = ChartType.Column.Clustered
column.AxisType = AxisType.Secondary
chart.SecondaryValueAxis.CategoryAxisCrossMaxValue = false
|
When you upgrade to version 4.0 or later, you can remove the last line if you wish. However, it is not required, since the line is simply setting the property explicitly instead of relying on the new default.
On the other hand you may want your column charts on the secondary axis to be drawn from the top. If you were relying on the default behavior of older versions of ExcelWriter to achieve this, you'll have to add a line of code when you upgrade to version 4.0:
|
[C#]
|
[VB.NET]
|
|
// Column chart on the secondary axis from the top in 4.0:
Chart chart = ws.Charts.CreateChart(ChartType.Line.StandardLine,
                                    ws.CreateAnchor(0, 2, 0, 0));
SeriesCollection series = chart.SeriesCollection;
Series column = series.CreateSeries(ws.CreateArea("A1:A20"));
Series line = series.CreateSeries(ws.CreateArea("B1:B20"));
column.ChartType = ChartType.Column.Clustered;
column.AxisType = AxisType.Secondary;
chart.SecondaryValueAxis.CategoryAxisCrossMaxValue = true;
'  Column chart on the secondary axis from the top in 4.0:
Dim chart As Chart = ws.Charts.CreateChart(ChartType.Line.StandardLine,
                                           ws.CreateAnchor(0, 2, 0, 0))
Dim series As SeriesCollection = chart.SeriesCollection
Dim column As Series = series.CreateSeries(ws.CreateArea("A1:A20"))
Dim line as Series = series.CreateSeries(ws.CreateArea("B1:B20"))
column.ChartType = ChartType.Column.Clustered
column.AxisType = AxisType.Secondary
chart.SecondaryValueAxis.CategoryAxisCrossMaxValue = true
|
Note that in either case, if you are explicitly setting the value of CategoryAxisCrossMaxValue you will not need to change your code. The meaning of this property has not changed, only its default value.
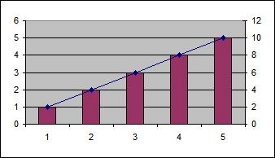
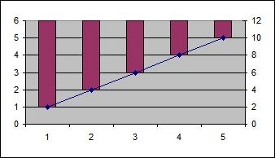
Figure 2: The image on the top shows a chart with the CategoryAxisCrossMaxValue property set to false. The image on the bottom shows the same chart with the property set to true.
|

